We've seen lots of reports over the years. Most of them are designed to be easy to create and repeatable. The goal for the agency is always to make things quicker and more process driven. These goals are great at improving consistency and driving profits for the agency. Put simply--they're easier. But that doesn't necessarily make them better.
CYS reports are different. Culturally we're curious. Click-through-rate in and of itself doesn't tell the whole story. Nor does CPC or traffic volume. These data points are all relevant undoubtedly, but without critical thinking and a connection back to overall business goals--they are just points on a map--not the path to growth.
Here's an example of a recent client report. It's half analytics and half narrative and all critical thinking:
...
Adwords Analysis
When we started with [Client] our specific goals were to not just sell more, but sell more of a specific type of product and sell them more profitably. Additionally, we are competing with the Amazon channel. Amazon charges roughly 20%, so for Adwords to be viable--we need to show if we can achieve a ROAS of +5:1
For Adwords to compete, we need to beat Amazon
In our first month in March we quickly realized we had some discrepancies with sales conversion data reporting in Adwords as a result of duplicate conversion tracking, one part coming from Adwords and one part coming from Google Analytics.
How to Count Conversions and Measure ROI
We needed to get the conversion data reporting correctly into Adwords to set us up for future bid strategies that optimize for ROAS. But for final reporting, we still had a choice to make which system to use. Between Adwords/Google Analytics and Big Commerce, for our analysis we’re choosing to use Google Analytics--for it’s ability to attribute conversions after the last click.
Historical Frame of Reference
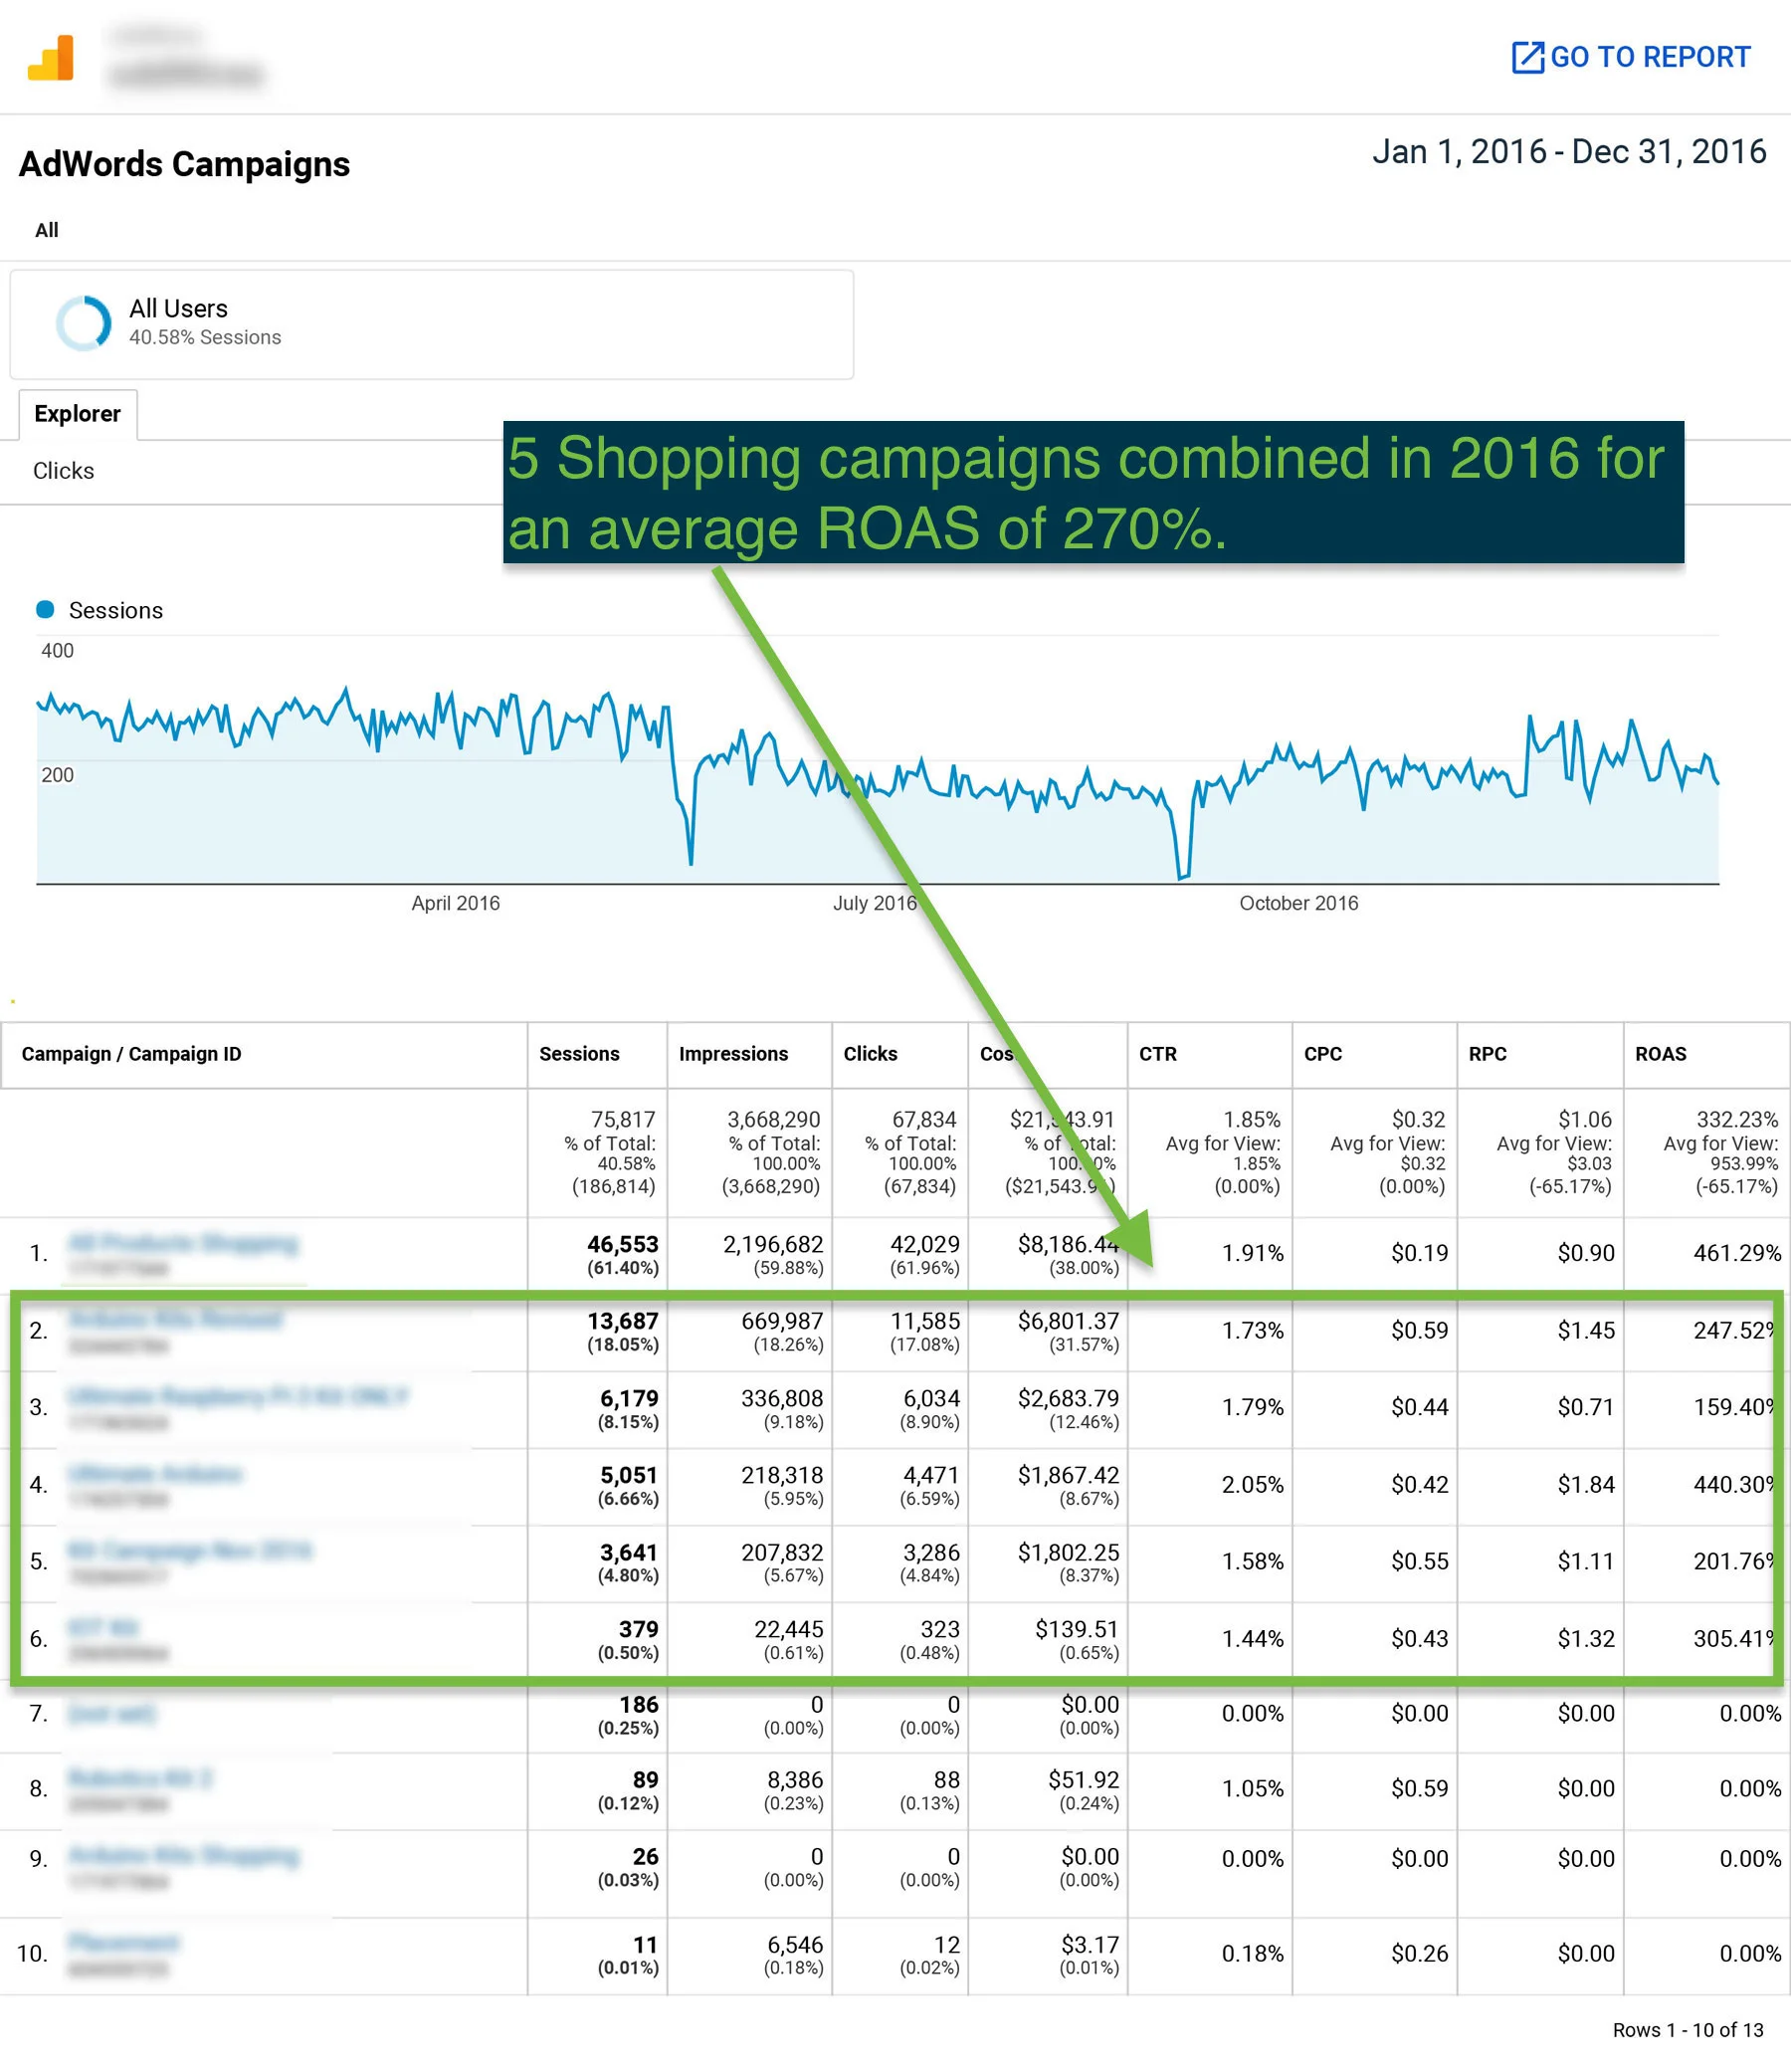
To establish a frame of reference we looked back at all of 2016. Excluding the “All Products” campaign and any campaign without a conversion, we totaled five separate campaigns targeting kits for an average ROAS of 270%
Comparing February, March, and April
By looking through the lens of specific product category sales we can compare the performance from the month before CYS dug in (Feb), our start up and learning month (Mar), and our first pass at a new strategy (Apr).
February:
One campaign, specifically targeting kit products, for an ROAS of 250%
March:
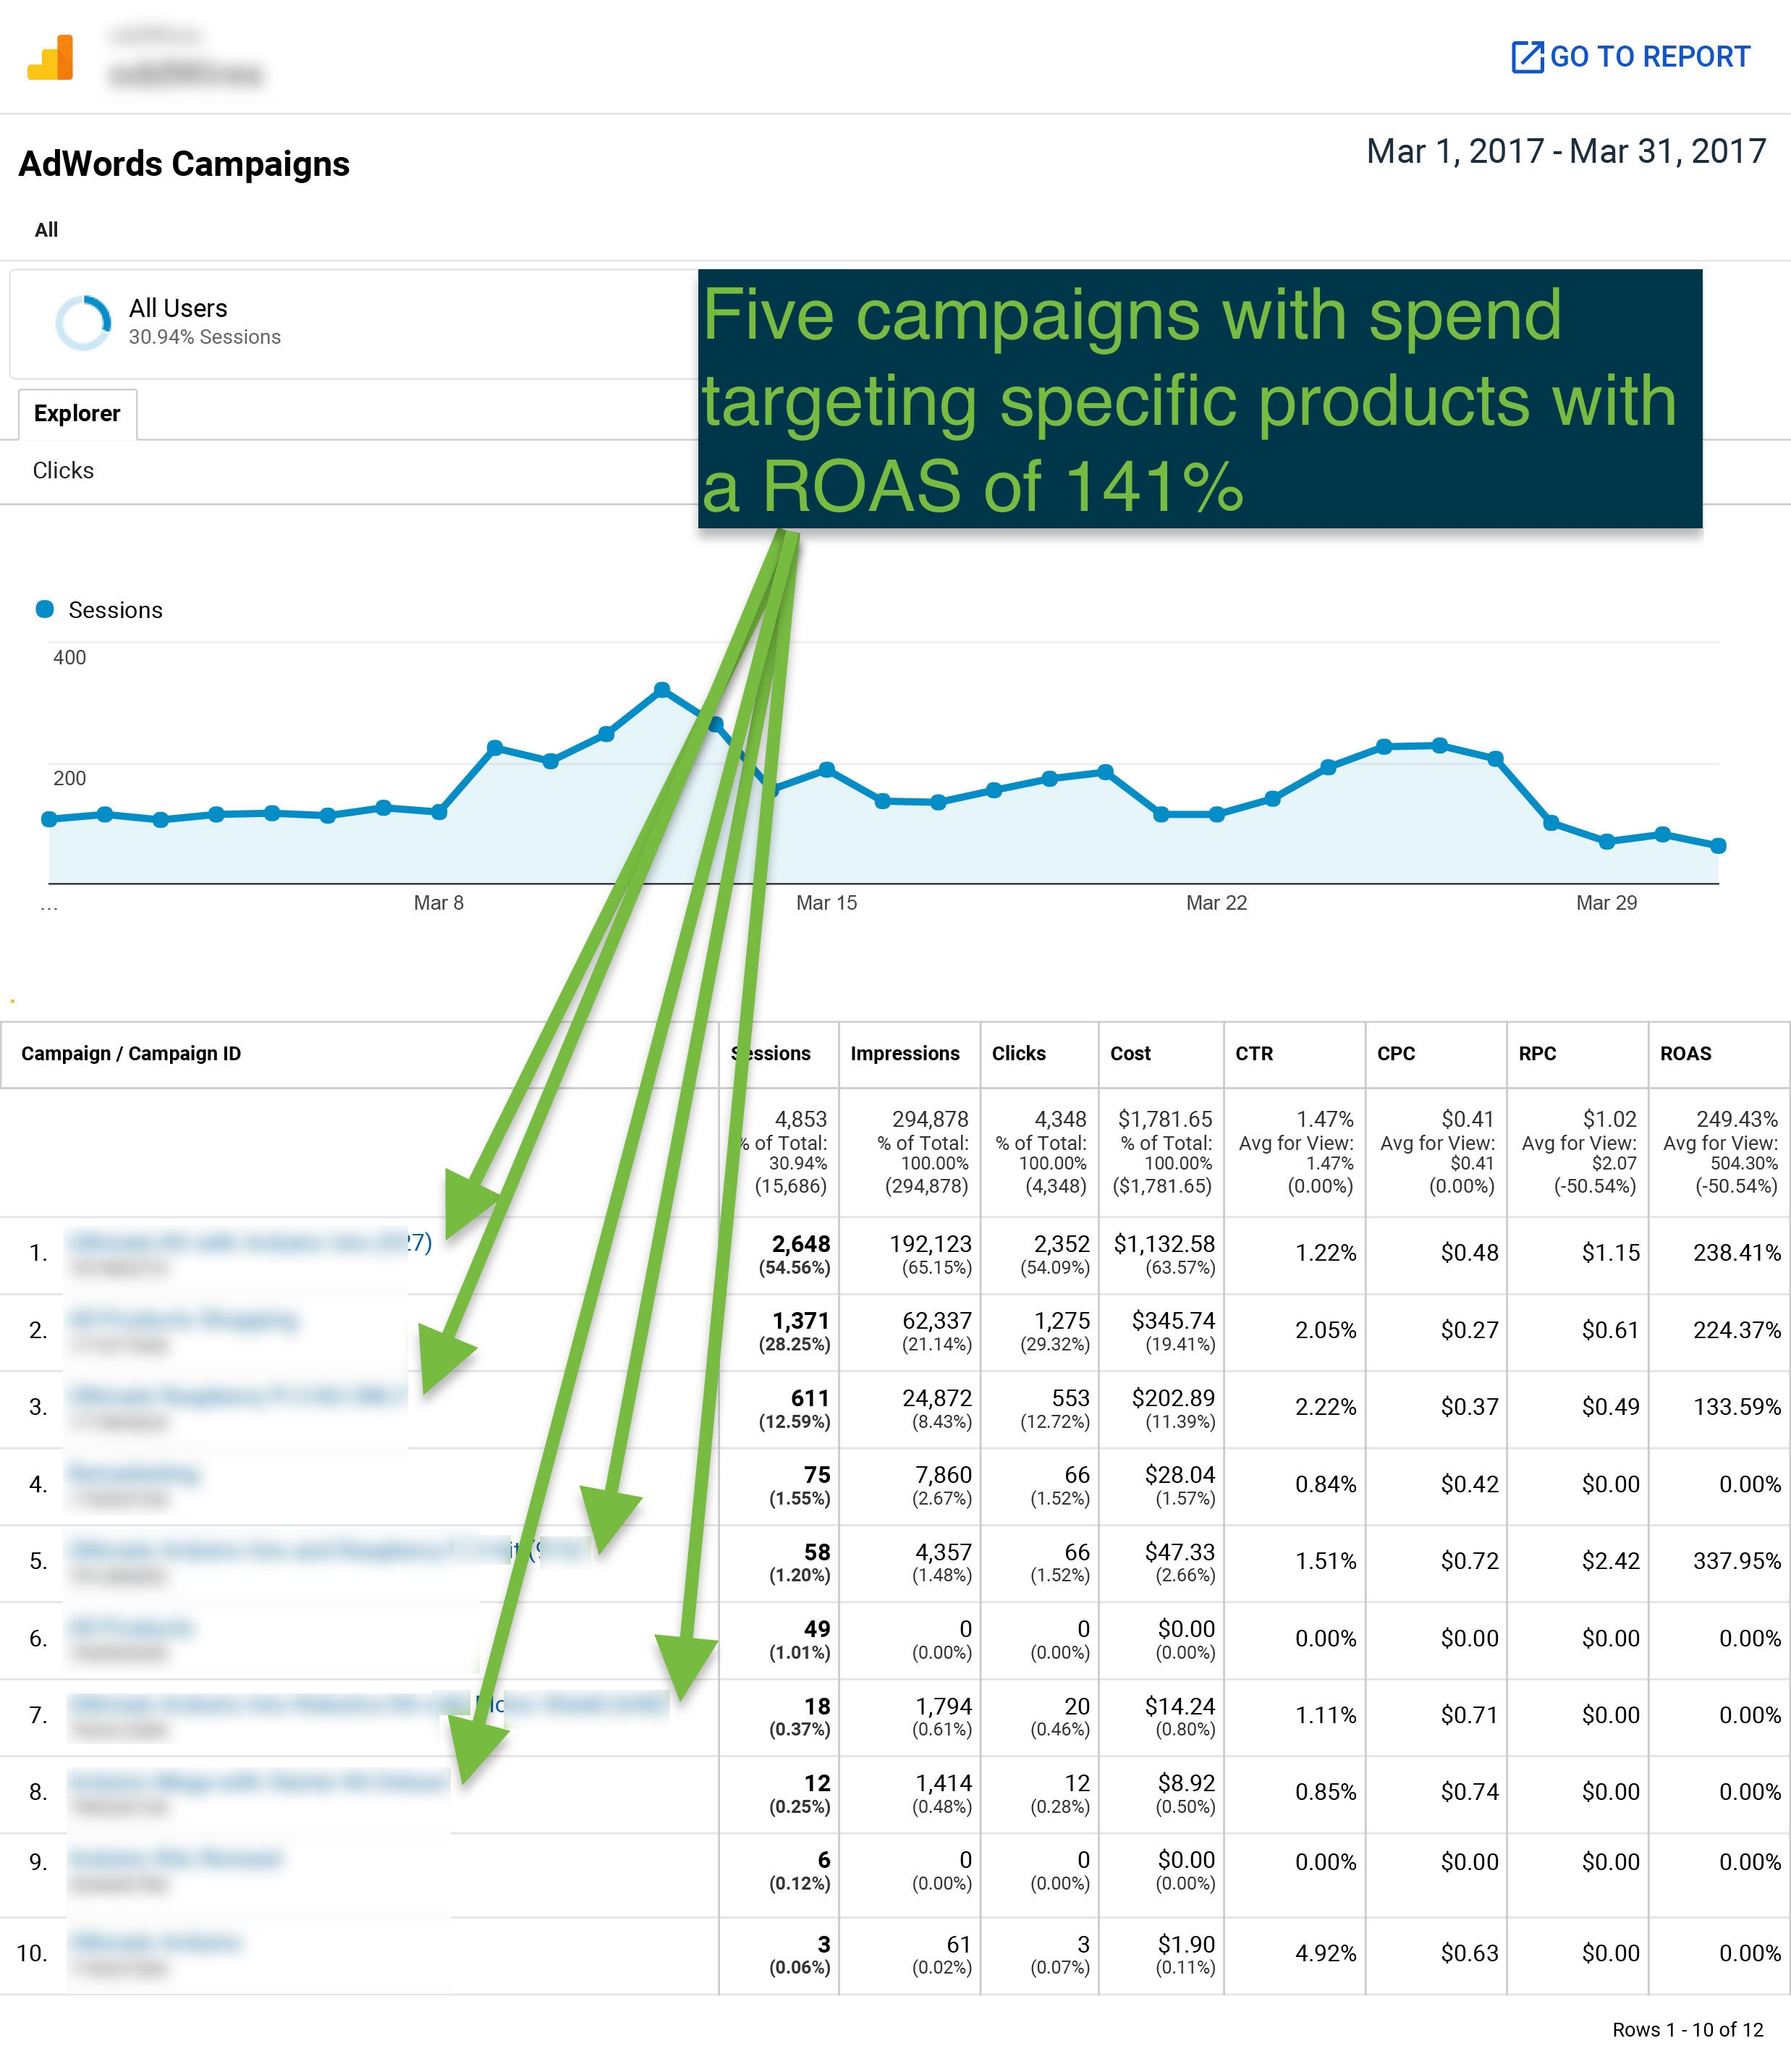
After getting our bearings in March we started the outlines of new campaign creation and ended up with five campaigns with spend for a ROAS of 141%
April:
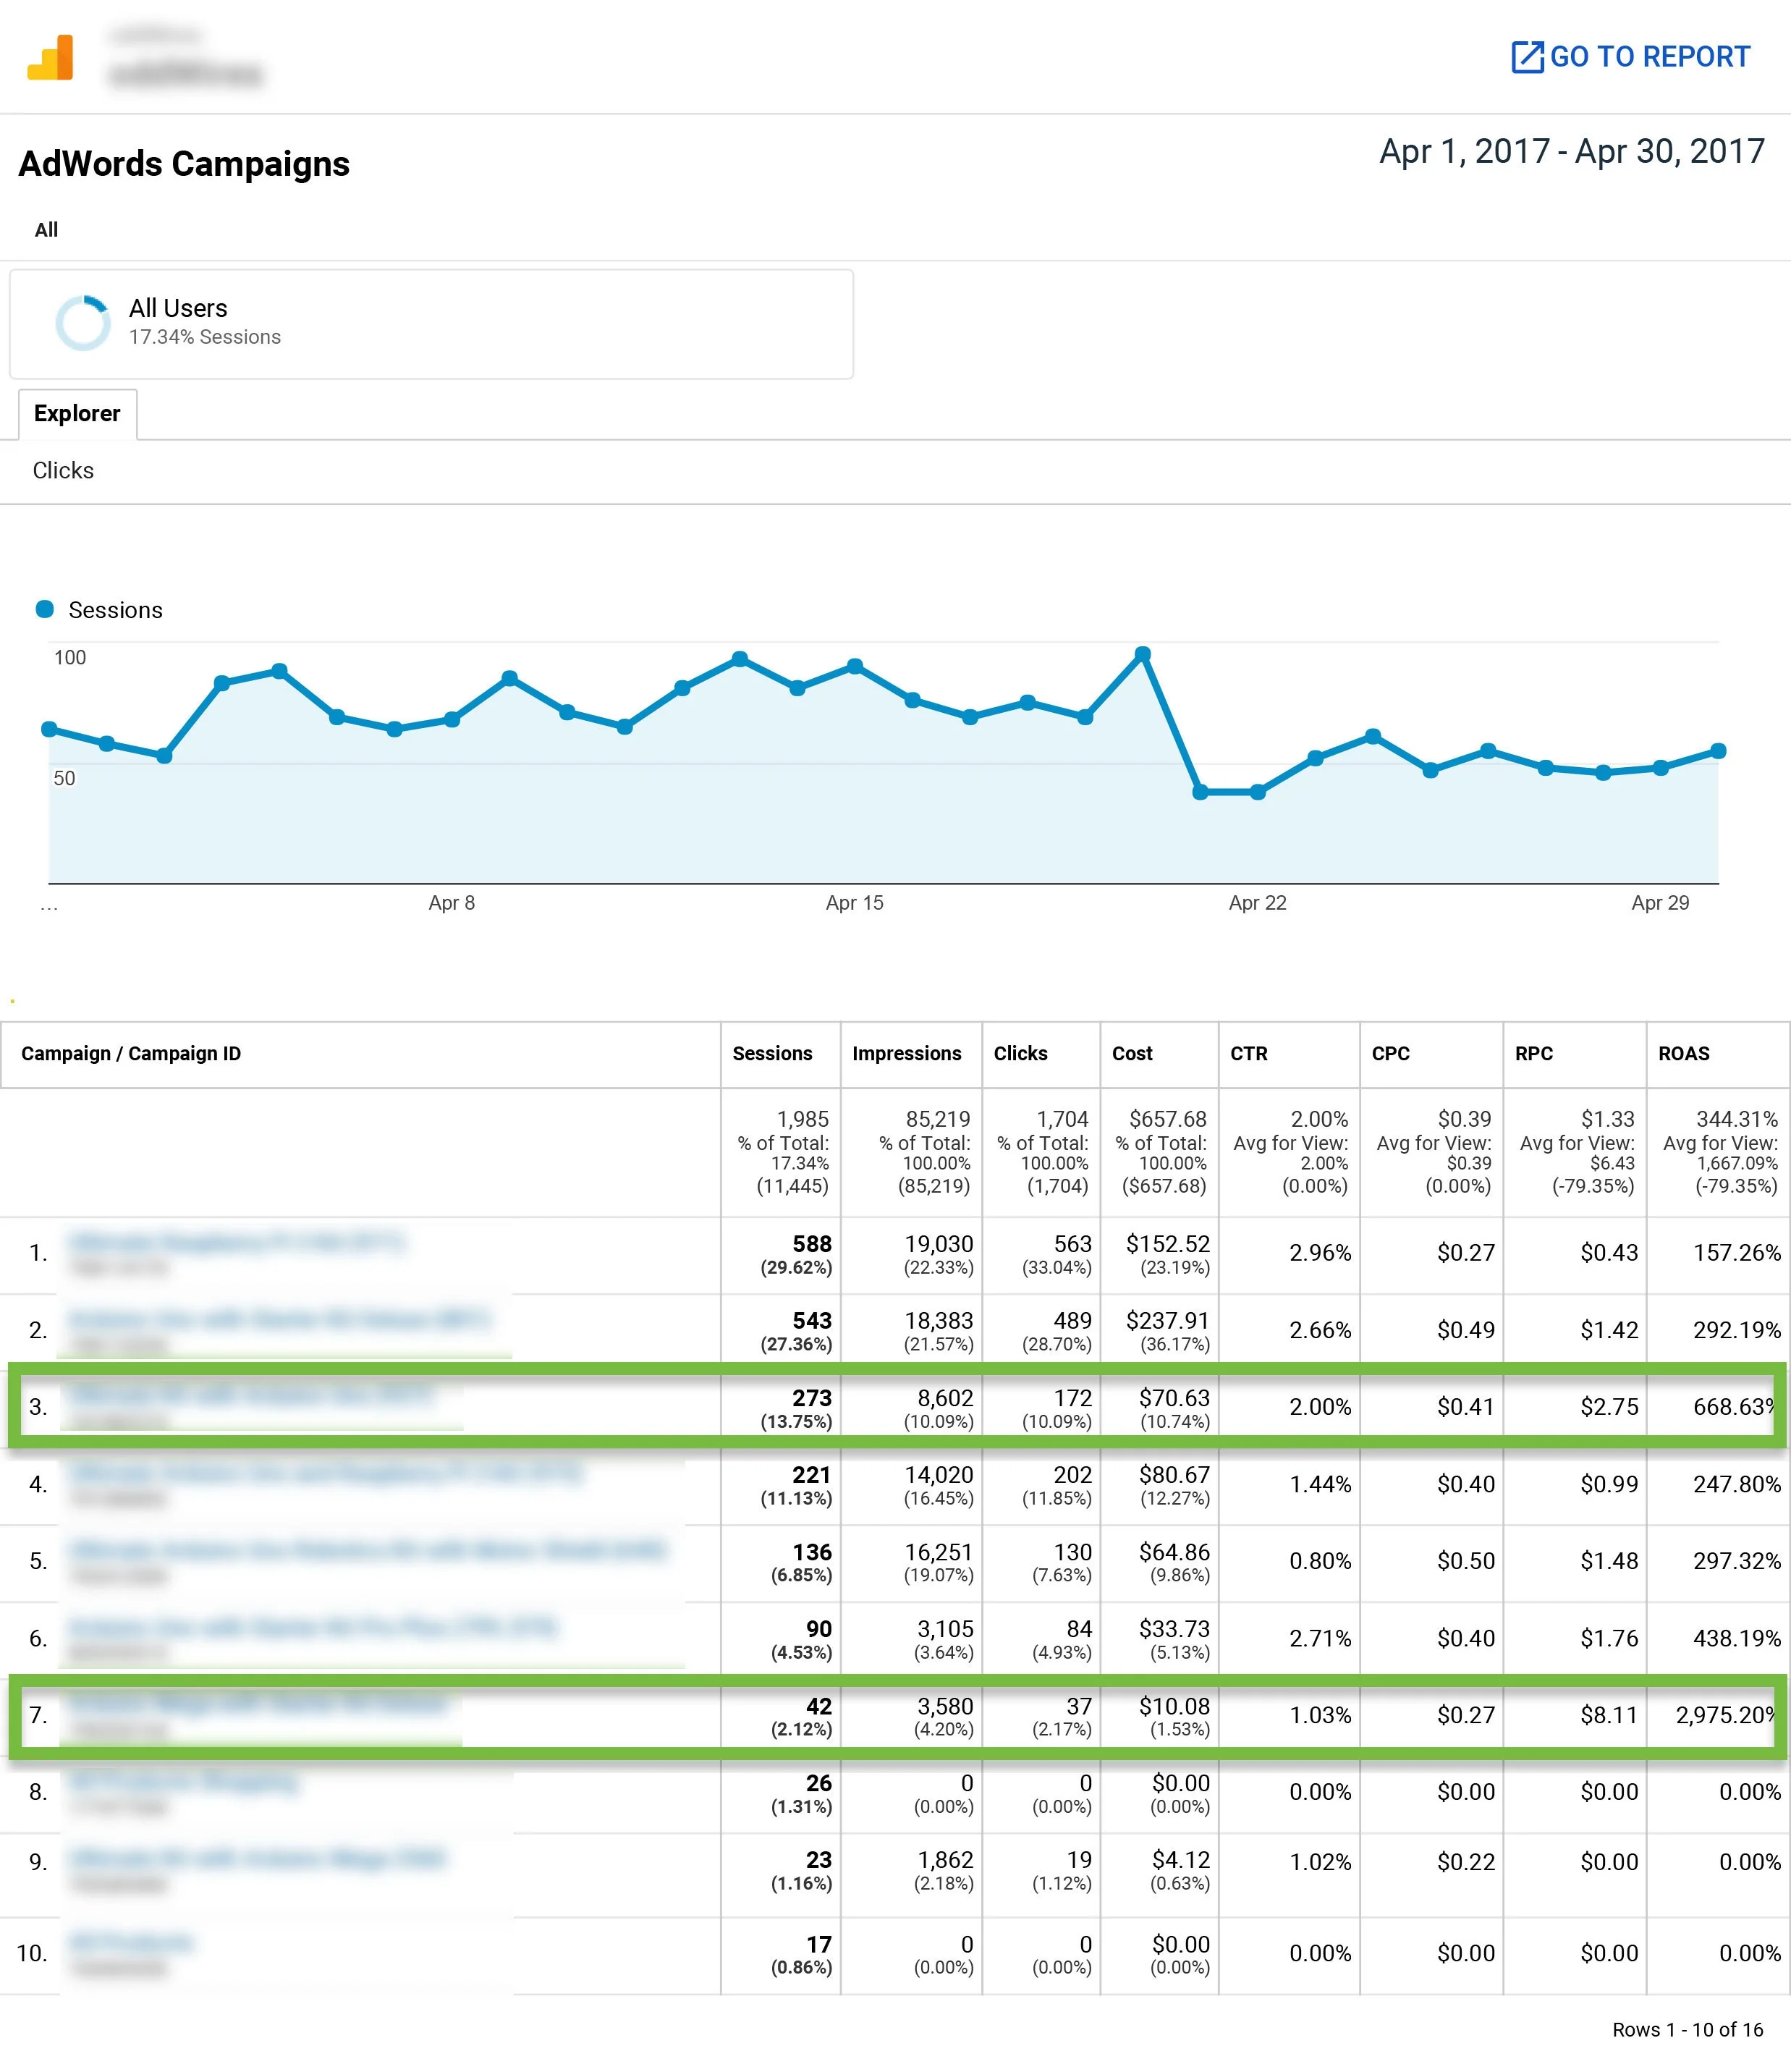
By April we ended up running entirely campaigns targeting specific products and ended the month with an ROAS of 344%, a 27% increase over the 2016 average. But the big win in our opinion isn’t really the marginal increase in ROAS performance, but the dramatic difference in the ability to see the performance on individual products--and test different theories and ideas that will ultimately lead to significant increases in ROAS
Comparison Study:
This is where the real fun started. Using the knowledge we developed about the products and their corresponding search terms, we developed a test that ran throughout April, comparing three different product variations with notable price differences--all targeting searches for [Client Keyword]. The results are preliminary, but interesting:
Adwords PLA Product Compairison Test
We would assume that price would have an effect on the entire model, and there appears to be some patterns. We like to see the increased CTR from the lower priced product. CTR is a critical component of auction dynamics, and raising it almost always leads to increased performance.
However we are curious about why the last variation had so much less spend and clicks in the same time period. It’s possibly related to the policy issue that we reported and begin troubleshooting after we attempted to start running the [client product]. That product had historically been disapproved from running as it was mistakenly classified as a restricted product (tobacco related).
Overall Average is Up, But There’s Winners and Losers Within
The comparison above is interesting, but still limited by its small data set. When we look at the entire month we see some different patterns with our three kits targeting [client keyword], notably that in this view, the [client product] looks to be performing the best. The difference is all in the time period. That campaign was actually started in the end of March, and by looking at only April you shave off some of the cost, but pick up all of the conversions, which aren’t happening everyday.
This is why the test’s value is interesting but not conclusive. We simply need more conversion data (either by running a longer test or by increasing the budget) to come to a conclusion.
Another take-a-way here--the [client product] is not doing well comparatively. The search terms report looks decent, and our spot checking has shown fairly decent visibility. There’s room for improvement undoubtedly, but I’m still surprised to see such poor performance.
Exact Match Script for PLA’s
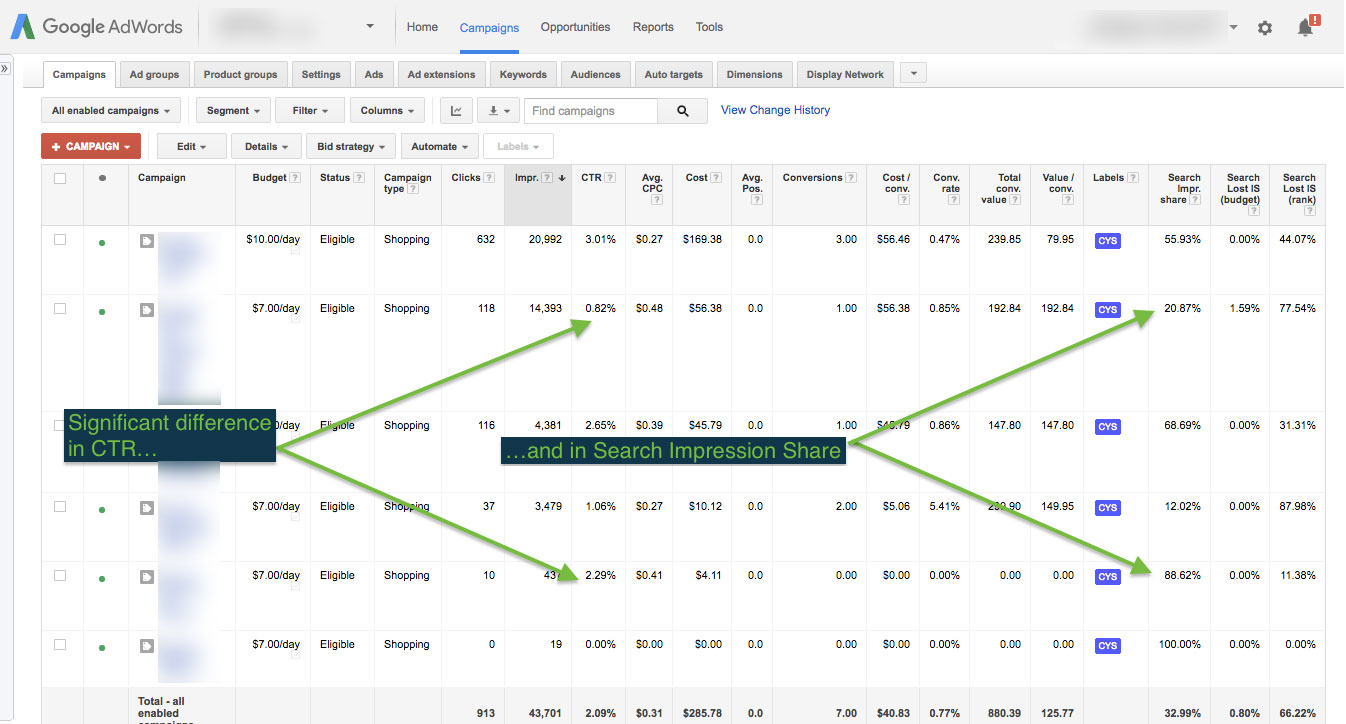
Here’s another test that we’re seeing interesting results from, but just need more conversion data. We’ve been working with an Adwords script that allows us to target exact match searches in PLA’s. Check out the search terms report for the campaign [client campaign].
We’re seeing really positive impacts on CTR and search impression share--but again, just not enough data to measure conversions.
Recommendations:
- We stopped running [client campaign] just while we were getting our hands around everything, but it’s time to turn it back on. It drives sales and has always done fairly well. It can probably be better, but it will be a process of chipping away at it and breaking out categories like we’ve done with these products.
- Keep testing, and keep working the negatives
- Continue experimenting with ‘exact match’ campaigns to maximize impression share for high quality searches


